The World of Coffee

An infographic on who drinks coffee, how much they spend on it, and how a berry from Ethiopia became a global habit.

By Erjon Ajazi, September 2026

Coffee is one of the most consumed drinks in the world, but the numbers behind it are hard to picture. The World of Coffee is an editorial infographic that turns those numbers into something you can read at a glance: how much each country drinks per person and in total, what a cup costs from Zurich to Hong Kong, and more than a thousand years of history, from the Oromo people of Ethiopia to today's specialty cafés.

I designed it as a six-spread publication with a consistent grid, rounded data tables, and a restrained color palette, then released it as an interactive digital edition.
View the full publication

The color palette

The palette is built on PANTONE 17-1230 Mocha Mousse, the Pantone Color Institute's Color of the Year 2025. Pantone describes it as a warm, soft brown that suggests coffee, cacao, and chocolate, which made it a natural anchor for a publication about coffee.

Around it I used a slightly deeper roast brown for tables and headlines, a pale crema tint for panels, a warm off-white for backgrounds, and a dark espresso brown for small type. Keeping the palette this narrow lets the photographs of real coffee beans carry the richest color on every page.

PANTONE 17-1230Mocha Mousse
Color of the Year 2025
RoastTables and headlines
#9C6F5C
CremaPanels and charts
#C9AEA6
FoamBackgrounds
#EFE9E2
EspressoSmall type
#3A2620

What's inside

The publication moves from the present to the past: first who drinks coffee and what they pay, then where coffee came from.

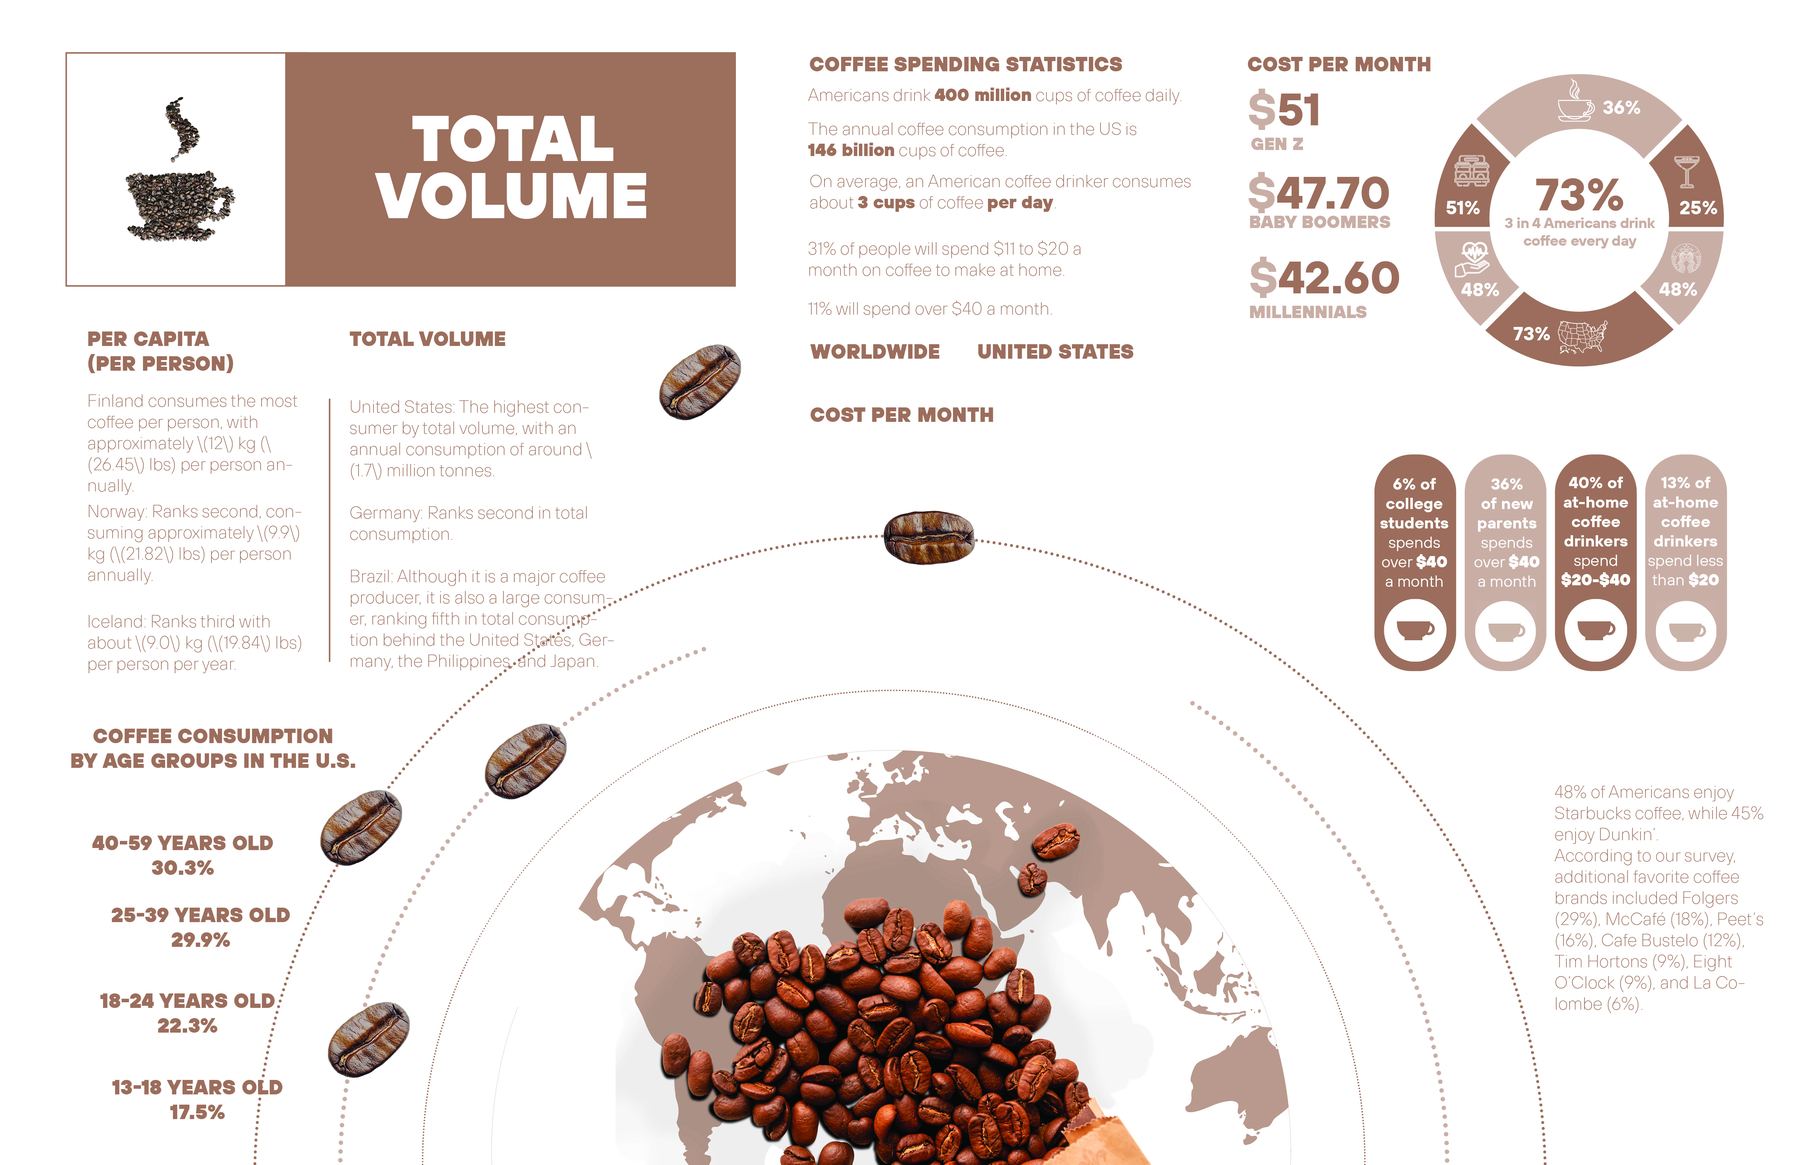
Infographic spread titled Total Volume, with U.S. coffee spending by generation, monthly spending groups, consumption by age group, and a world map filled with roasted coffee beans

Total volume and spending. The opening spread shows the scale of the habit. Americans drink about 400 million cups a day, and monthly spending differs by generation, with Gen Z spending the most. A world map filled with roasted beans anchors the comparison between consumption per person and total volume.

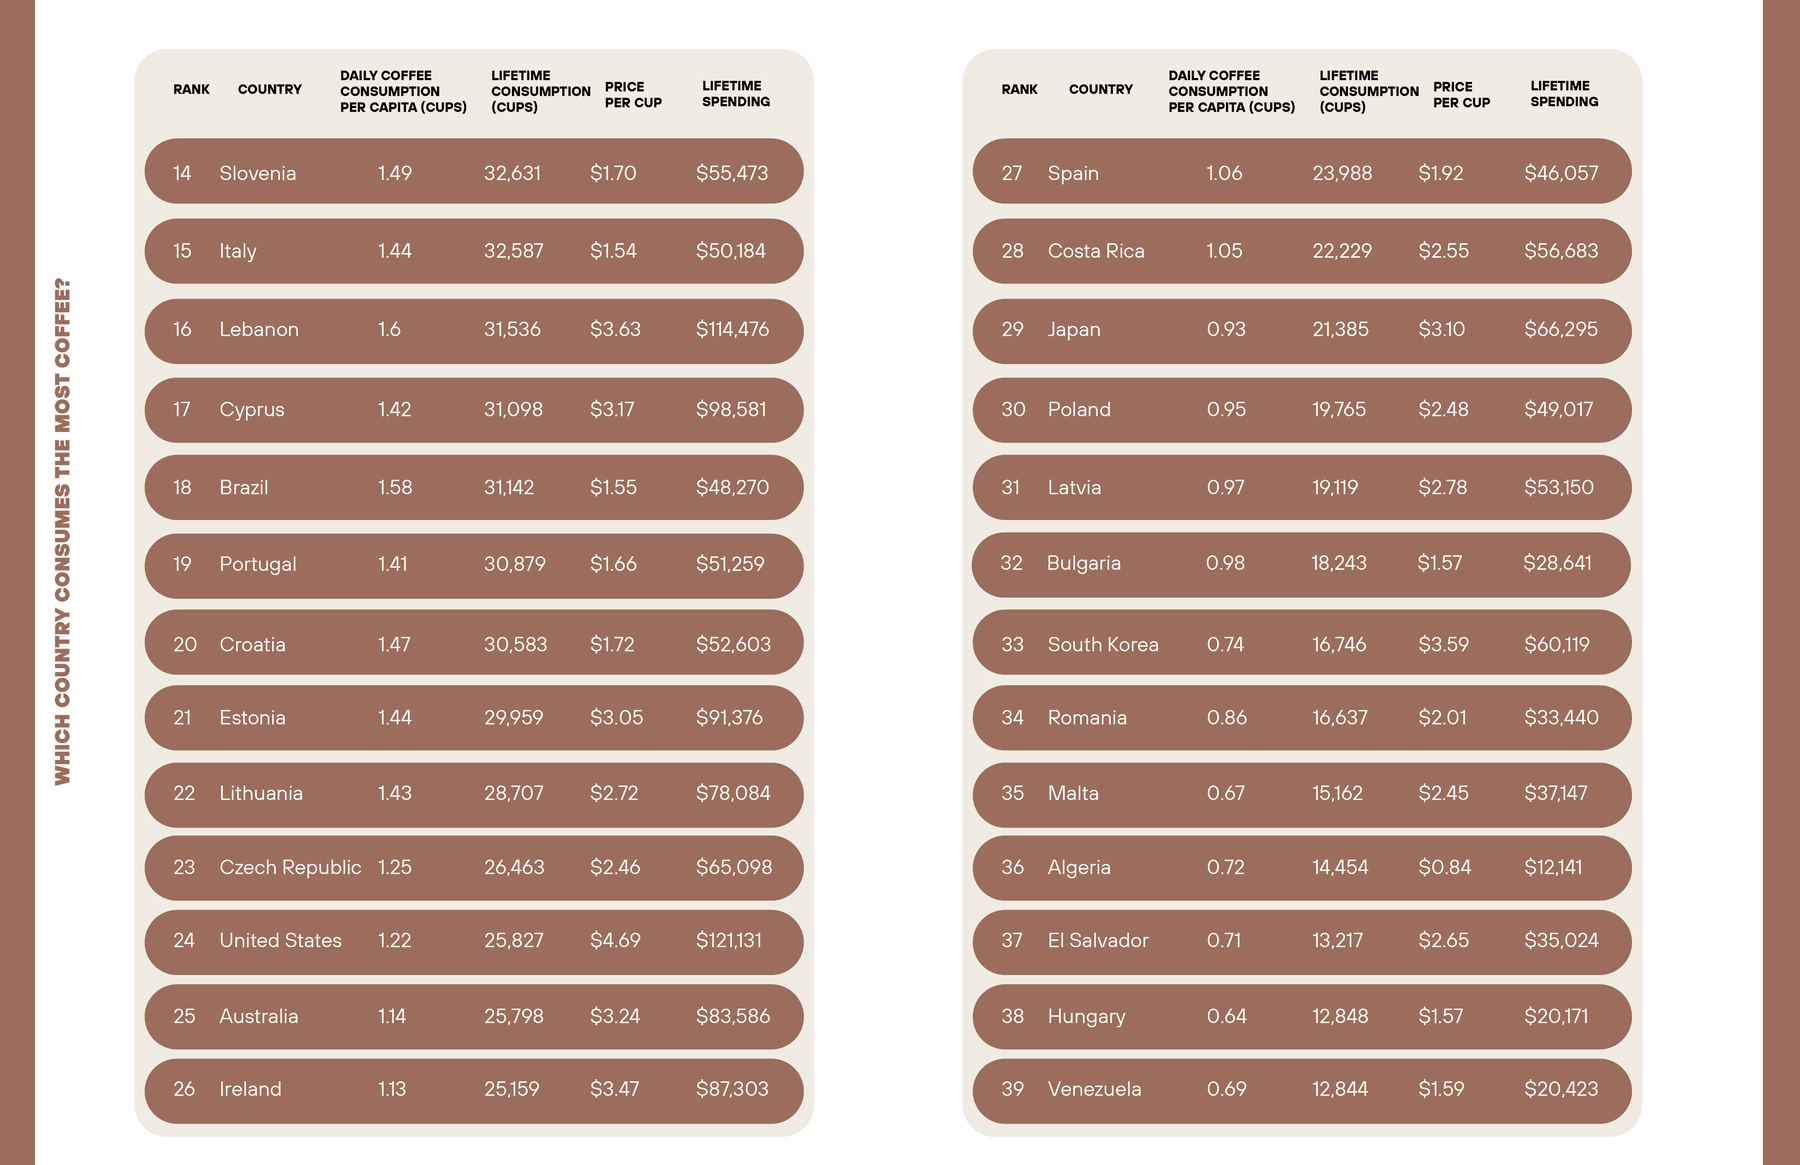
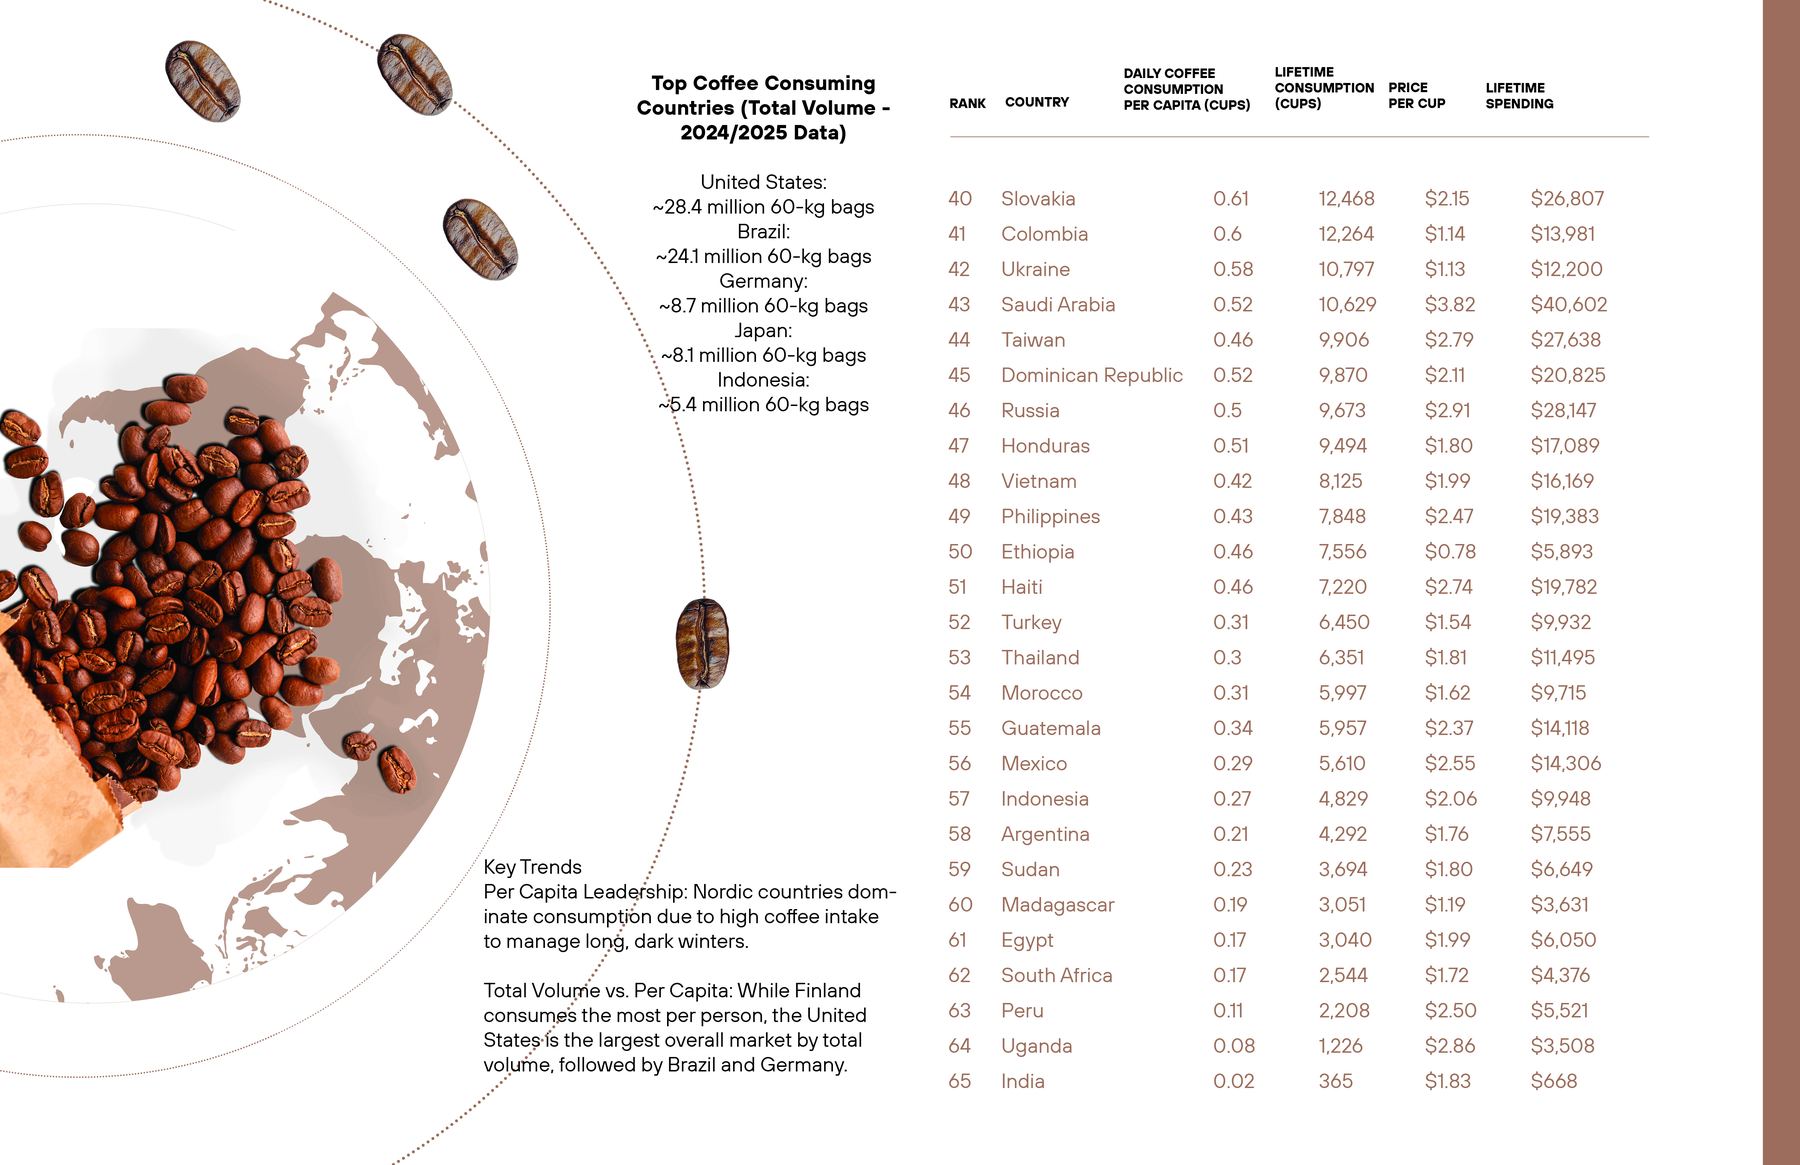
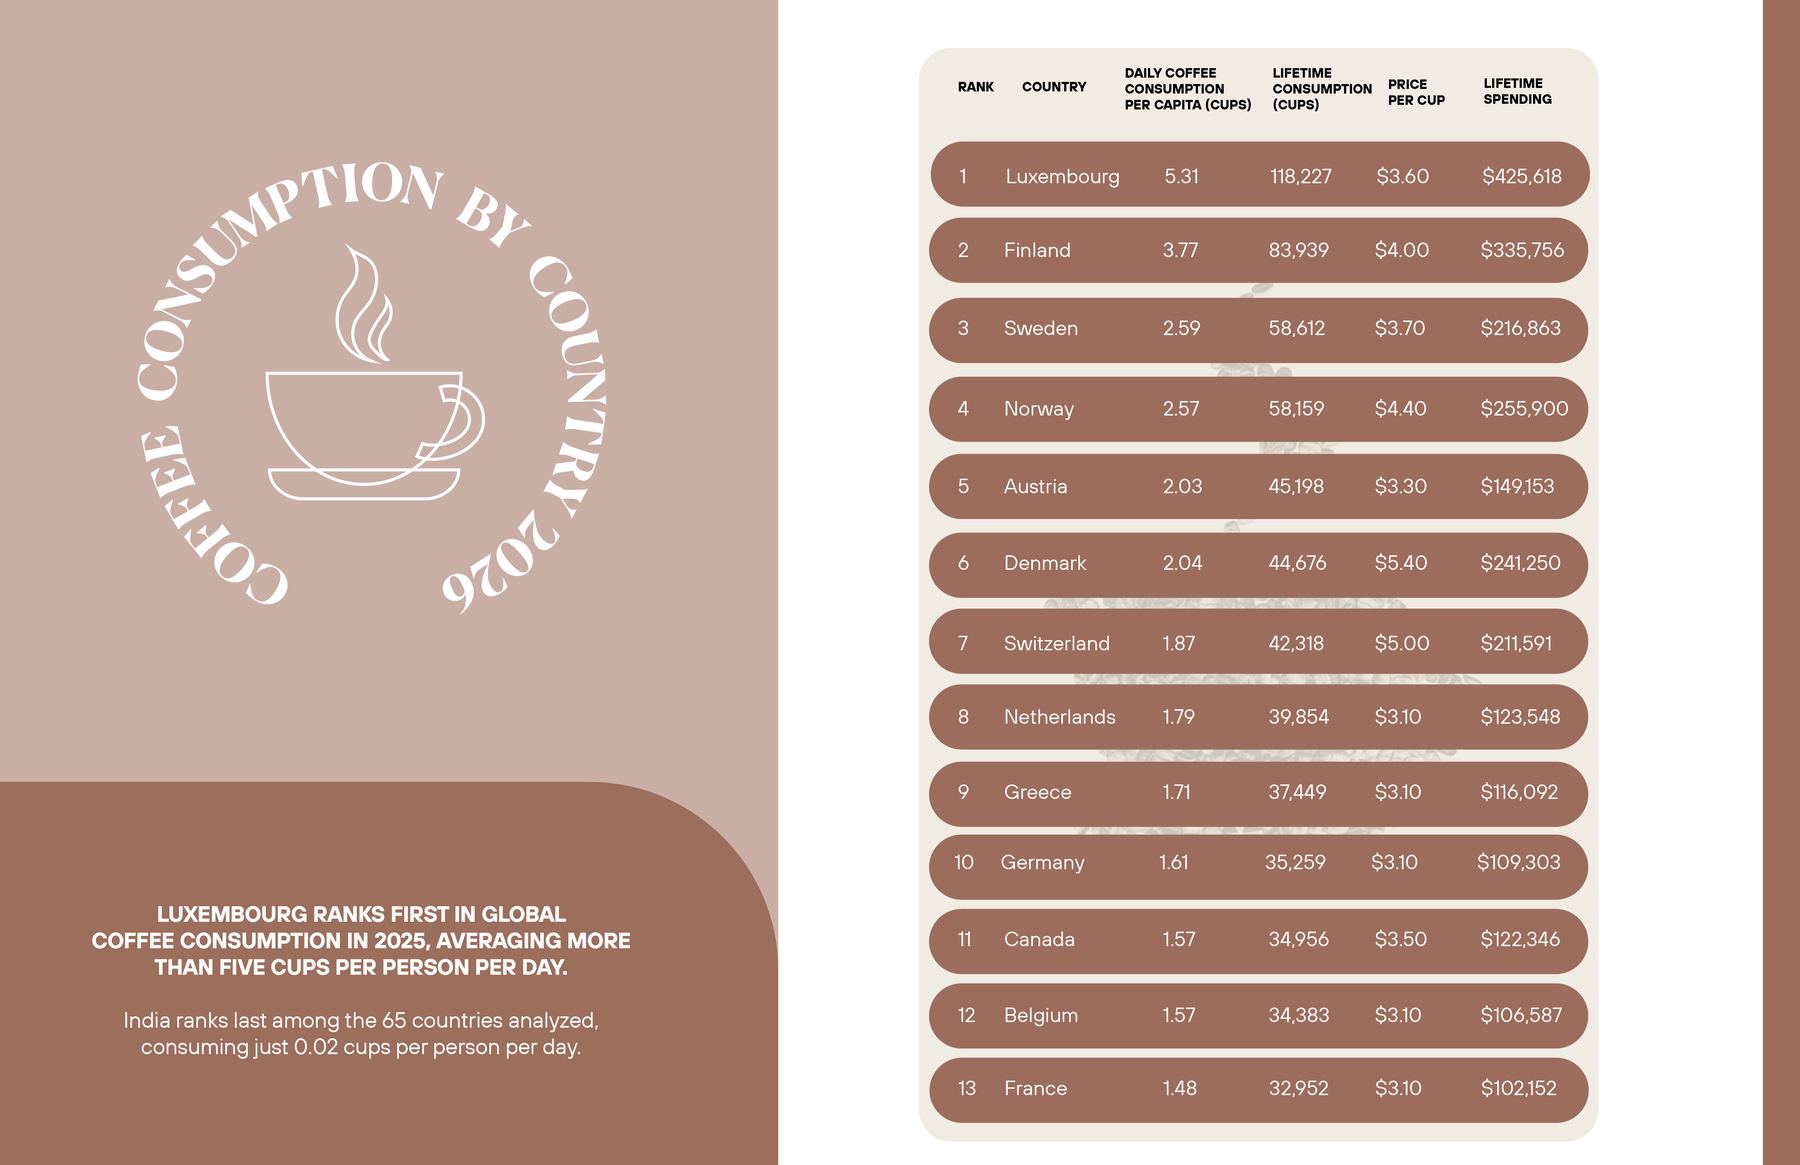
Spread titled Coffee Consumption by Country 2026, ranking countries 1 to 13, led by Luxembourg at 5.31 cups per person per dayTwo ranking tables for countries 14 to 39, including Italy, Brazil, the United States, Spain and JapanRanking table for countries 40 to 65, ending with India at 0.02 cups per day, beside a world map of coffee beans and a list of the top consuming countries by total volume

Consumption by country. Three spreads rank 65 countries by daily cups per person, cups over a lifetime, price per cup, and lifetime spending. Luxembourg leads with 5.31 cups a day and India is last at 0.02. The United States, the largest market by total volume, ranks 24th per person.

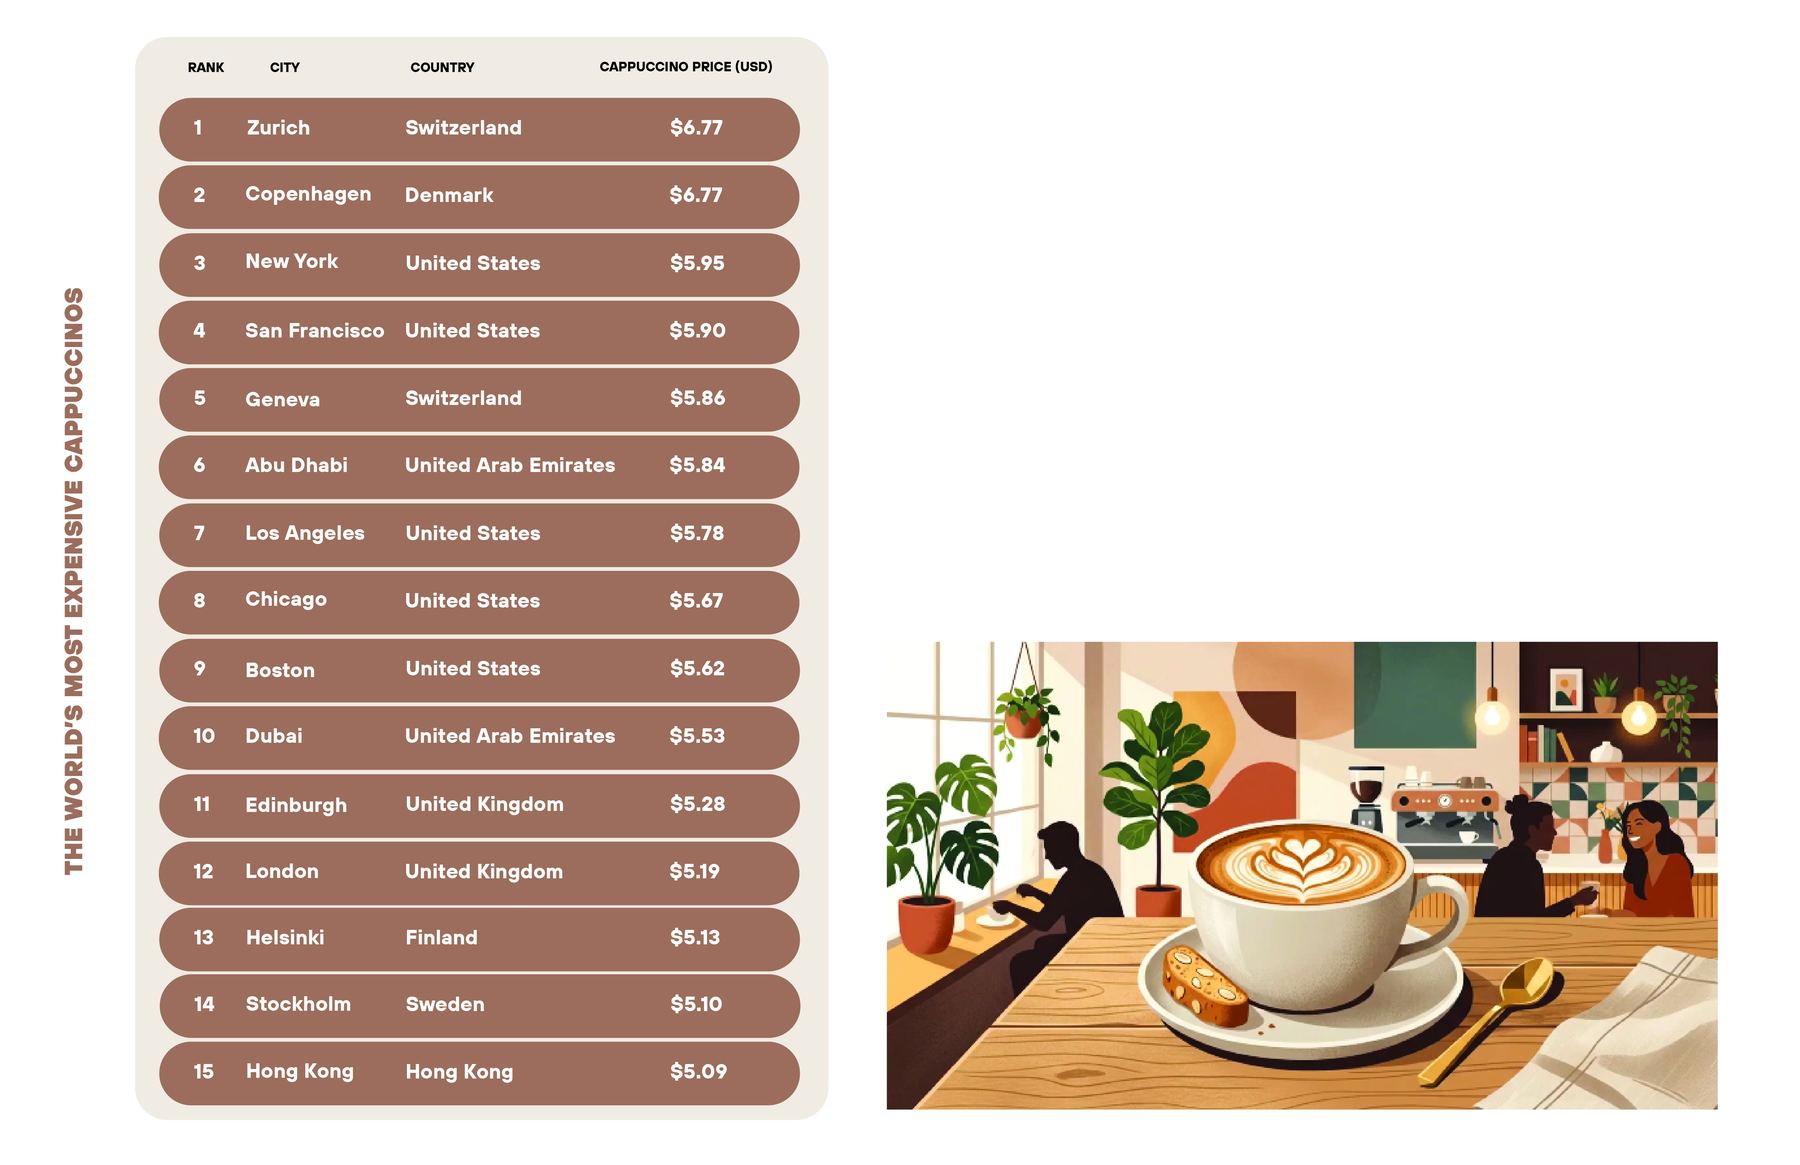
Table of the world's most expensive cappuccinos, led by Zurich and Copenhagen at $6.77, beside an illustration of a cappuccino in a café

The world's most expensive cappuccinos. Zurich and Copenhagen tie for first at $6.77 a cup. Five of the ten most expensive cities are in the United States, led by New York at $5.95.

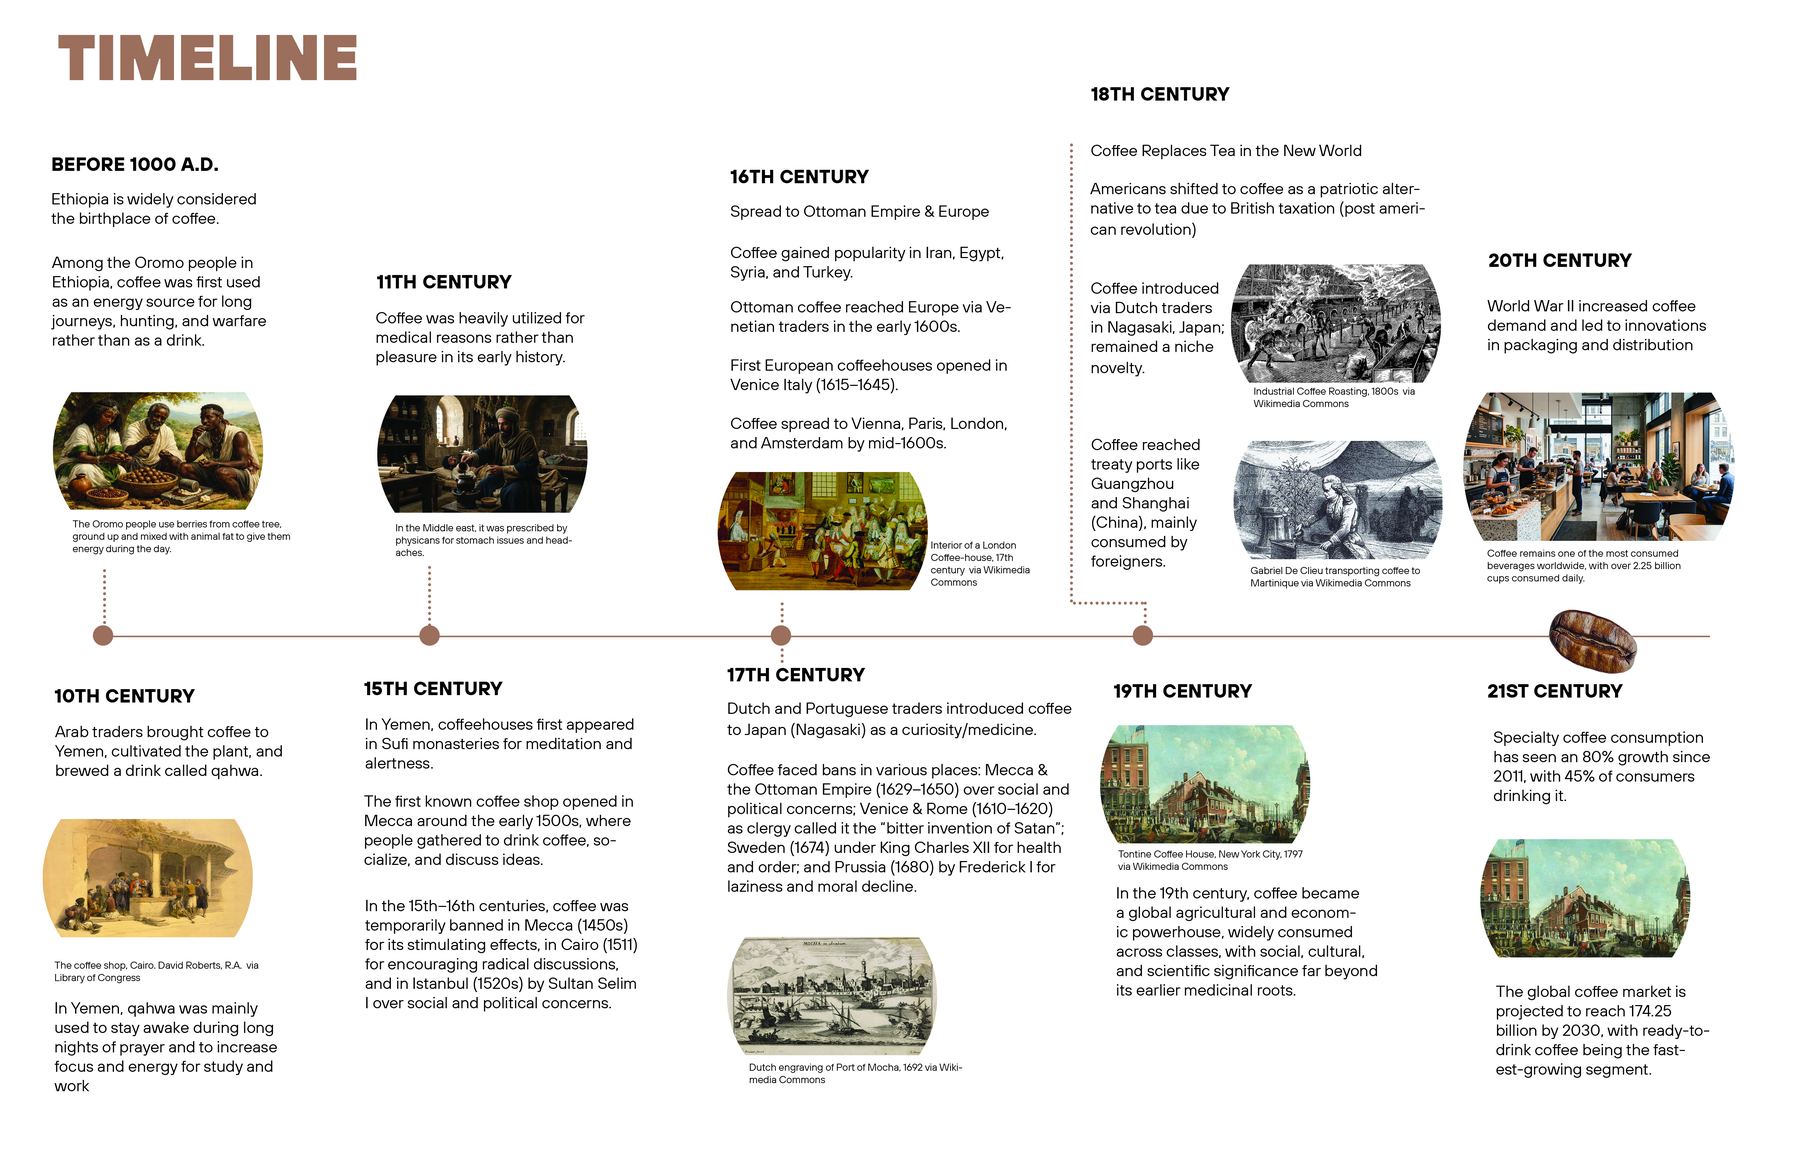
Timeline of coffee history from before 1000 A.D. to the 21st century, illustrated with historical engravings and paintings of coffeehouses and coffee trade

Timeline. Coffee's history from before 1000 A.D. to today: its first use among the Oromo people of Ethiopia, the qahwa of Yemen, the first coffeehouses in Mecca, Venice, and London, bans in several cities, and its growth into a global industry. Archival engravings and paintings illustrate each era.

View the full publication

Sources

  1. National Coffee Association, History of Coffee, About Coffee.
  2. Get Roasted, A History of Coffee in a Nutshell, August 31, 2022.
  3. Visual Capitalist, Mapped: The World's Most Expensive Cappuccinos, 2025.